Financial Review
* i.e. excluding exceptional gain/losses
Total Operating Income Break-up
(` Crores or as stated)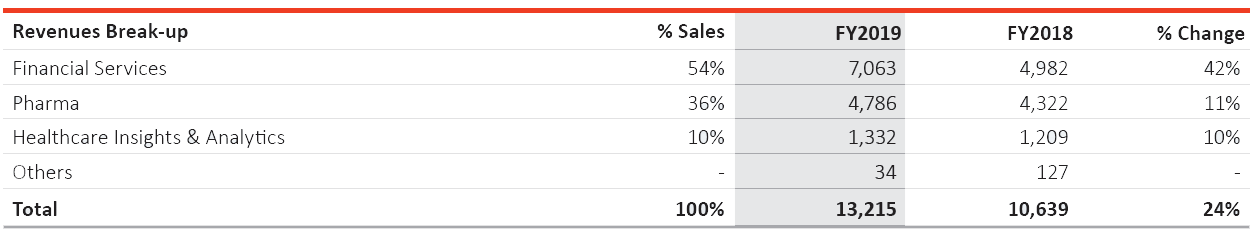
CONSOLIDATED FINANCIAL PERFORMANCE
PEL’s consolidated revenues grew by 24% to `13,215 Crores in FY2019 as compared with `10,639 Crores in FY2018. The rise in revenues is primarily driven by growth in the Financial Services segment. Revenues generated in foreign currencies are 40% of PEL’s FY2019 revenues.
Business-wise Revenue Performance
Income from the Financial Services business expanded by 42% to `7,063 Crores in FY2019 as compared to `4,982 Crores in the previous year. This growth was on account of 34% growth in loan book from `42,168 Crores as on March 31, 2019 to `56,624 Crores as on March 31, 2018. The growth in loan book is largely attributed to an increase in Real Estate Developer Financing and Housing Finance.
The Pharma4 business revenues increased by 11% in FY2019 to `4,786 Crores vis-à-vis `4,322 Crores for FY2018. Global Pharma, which accounts for 93% of the Pharma revenues, reported a growth of 12% in FY2019 to `4,452 Crores as against `3,976 Crores in FY2018. The increase was on account of strong order book and delivery across all key segments of the business. India Consumer Products reported revenues for FY2019 at `334 Crores.
Revenues from the Healthcare Insights & Analytics business increased by 10% in FY2019 to `1,332 Crores vis-à-vis `1,209 Crores for FY2018. Revenue growth was primarily driven by strong growth in Life Sciences and Data Analytics. The Company continues to evolve its delivery model from large, static research reports to digitally delivered, user-centric applications and analytics services.
VIJAY SHAH
Executive Director, PEL
"Despite a challenging business environment, PEL continued to deliver robust performance driven by growth across our Financial Services and Pharma businesses. In Financial Services, we continued to grow by further diversifying our loan book and increasing the share of Housing Finance, despite system-wide liquidity tightening. We also tapped additional sources of long-term funds and diversified our borrowing mix. In the Pharma business, our differentiated business model and focus on quality has enabled us to consistently grow revenues and improve margins, despite pricing pressures and regulatory headwinds being faced by the industry. Going forward, we remain committed to generating value for all our stakeholders.”
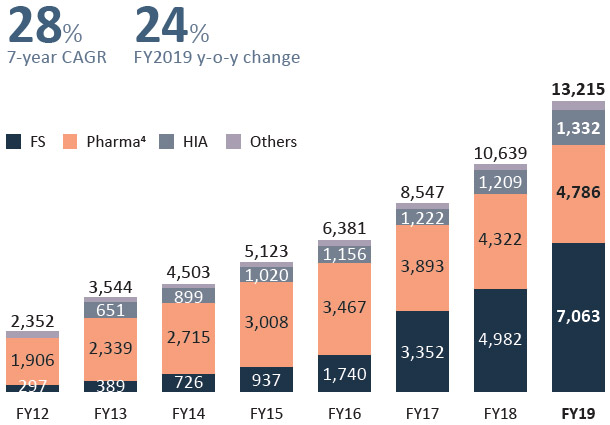
Business-wise Revenue Trend and Normalised Net Profit and Margin Trend
Business-wise Revenue Trend (` Crores)
Normalised Net Profit1,2,3 (` Crores)
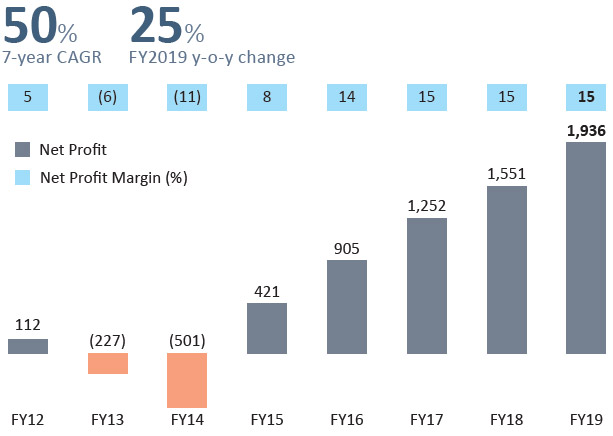
- FY2016 - FY2019 results have been prepared based on IND AS; prior periods are IND GAAP.
- FY2015 net profit excludes exceptional gain on sale of 11% stake in Vodafone India, partly offset by the amount written down on account of scaling back of our investments in NCE research.
- FY2019 normalised net profit excludes non-recurring and non-cash accounting charge towards imaging assets and non-recurring exceptional item and FY2018 normalised net profit after tax excludes synergies on account of merger of subsidiaries in the Financial Services segment.
- Pharma includes Global Pharma and India Consumer Products.
Financial Highlights (Consolidated)
P&L Performance (` Crores or as stated))

Note:
- Income under share of associates primarily includes our share of profits at Shriram Capital and profit under JV with Allergan, as per the new accounting standards.
- FY2019 normalised net profit excludes non-recurring and non-cash accounting charge towards imaging assets and non-recurring exceptional item.
- FY2018 normalised net profit after tax excludes synergies on account of merger of subsidiaries in the Financial Services segment.
- Diluted EPS for March 31, 2019 and Mar 31, 2018 have been restated for effect of rights issue.
Finance Costs
Finance costs for FY2019 were `4,410 Crores as compared to `2,978 Crores in FY2018. The increase was primarily due to higher borrowings in the Financial Services business and a marginal increase in interest rates.
Depreciation
Depreciation for FY2019 stood at `520 Crores as compared to `477 Crores in FY2018. The increase was primarily due to increased capitalisation of the amounts invested for Pharma acquisitions.
Taxation
Current tax and deferred tax expenses were at `861 Crores in FY2019 as compared `693 Crores in FY2018, primarily on account of an increase in profits largely from the Financial Services business. During FY2018, there was a creation of deferred tax asset of `3,569 Crores on account of the merger of subsidiaries in the Financial Services business, which led to an exceptional gain in reported net profits.
Net Profit after Tax
Reported net profit after tax for FY2019 stood at `1,470 Crores vis-à-vis `5,120 Crores in FY2018 as a non-recurring exceptional gain amounting to ₹3,569 Crores on account of creation of deferred tax asset due to merger of subsidiaries in FY2018.
Normalised net profit for FY2019 grew 25% to `1,936 Crores vis-à-vis `1,551 Crores in FY2018 on account of improved operational performance across businesses.
Dividend
The Company paid a final equity dividend of `28 per share. This would entail a total payout of `558 Crores (excluding dividend distribution tax). The dividend payout ratio was 29% for FY2019.
Net Worth
The net worth as on March 31, 2019 was `27,253 Crores as compared to `26,562 Crores as on March 31, 2018. The increase in the equity is primarily on account of an increase in profits due to improved operational performance across all segments.
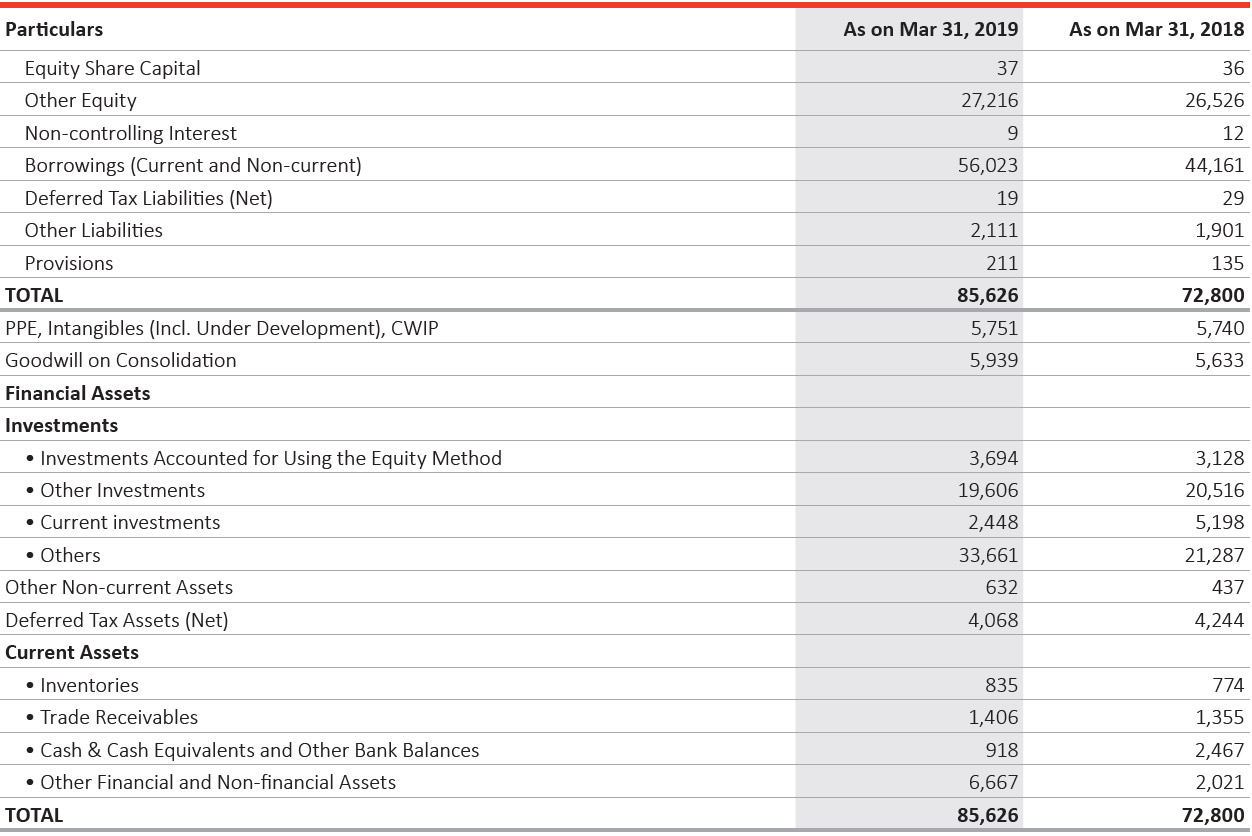
Balance Sheet (` Crores )
Financial Assets
Financial assets as on March 31, 2019 is `59,409 Crores compared to `50,129 Crores as on March 31, 2018. The rise is mainly on account of an increase in the size of the loan book.
Goodwill
During FY2019, goodwill increased by ₹307 Crores, primarily on account of translation of goodwill from functional currency to reporting currency.
Borrowings
Total borrowings as on March 31, 2019 were `56,023 Crores as compared to `44,161 Crores as on March 31, 2018. Increase in borrowings during the year was primarily on account of higher investments in the Financial Services segment.
VIVEK VALSARAJ
CFO, PEL
"The consistent growth in profits is driven by strong performance across our business segments. We had made significant capital allocations to our businesses following the fund raise of ~`7,000 Crores in the prior year, which has increased the resilience of our businesses and yielded strong results."